|
By Dr. Vijayalakshmi (Viji) Kalyanaraman
Lithium-ion (or Li-ion) batteries rule the world of mobile devices. However, they are still in their infancy when it comes to powering up automobiles. Higher capacity and long lasting life are the keys to exploit them in automobile industry. Why is developing high performance Li-ion batteries a challenge?
During the battery operation, the electrode components undergo irreversible changes chemically, structurally and morphologically which are harder to pinpoint with presently available tools. Electrode components are made from microsized particles and often nanoparticles (1 nm = 1000,000 times smaller than the thickness of a human hair). A central mechanism that governs all lithium ion type batteries, including the one that we use everyday is, “shuttling of Li – ions between cathode and anode during charge/discharge cycle.
What do you infer from the picture below? 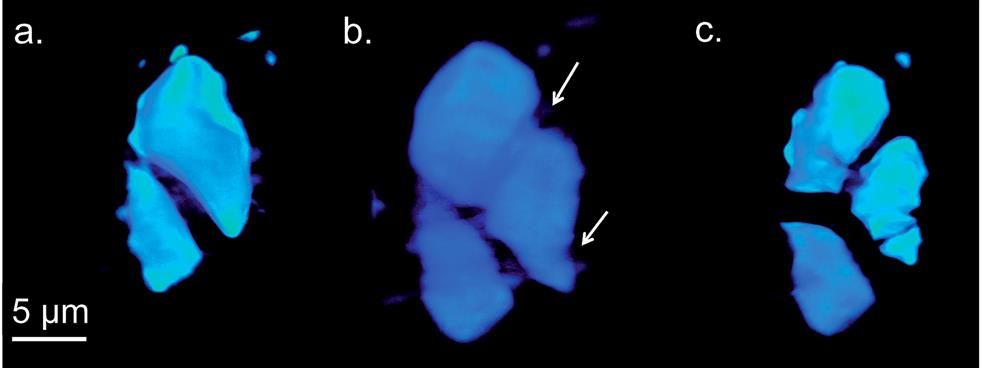
Figure 1 A Ge nanoparticle agglomerate at the electrode of LiGe battery, before charging (a), after charging (b) and after discharging (c) from Energy and Environmental Science, 2014, 7, 2771. DOI: 10.1039/c4ee01384k
A micrometer-sized particle is swelling and breaking apart. And what If I tell you this particle makes the electrode in your cell phone battery? Shocking? What you see is an agglomerate of Ge nanoparticles that form the cathode in Ge-Li battery imaged by transmission x-ray microscopy (TXM) in tomography mode (3D), “in operando” – meaning imaging while the battery is being charged and discharged. As the particles that make up the electrode pulverize, they lose electrical contact with each other, sabotaging battery capacity and lifetime. Ge based electrodes in a Li-ion rechargeable battery could offer four times higher power than the currently used Li-ion battery types. But this irreversible damage of electrodes prevents us from taking advantage of Ge based Li-ion batteries.
What makes the particles crack after charging? Upon charging, lithium is released from the anode and it alloys with germanium at the cathode (GeLi4). Since each Ge atoms takes up four lithium ions, volume of the agglomerates increase enormously, fracturing at thinner regions, which the arrows indicate. Look at the colorful picture below showing a series of images, during charging and discharging, of an electrode in a Li-ion battery that we all currently carry in our smart phones. 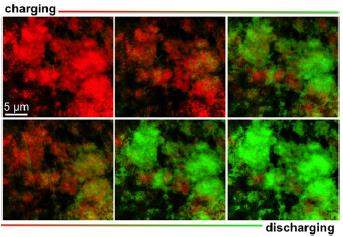
Figure 2 chemical imaging of LiFePO4 electrode with TXM. Fully charged - green: fully discharged – red, from ChemElectroChem 2015, 2, 1576-1581
What you see are agglomerates of LiFePO4 nanoparticles that form the cathode in Lithium phosphate batteries. The images are obtained by (2D) imaging with transmission x-ray microscopy (TXM) and are color coded to distinguish between iron in two chemical states. Fe2+ (as LiFePO4) is green and Fe3+ (as FePO4) is red. Fe3+ (red hue) upon charging, gradually turn into Fe2+ (green hue); the reverse happens upon discharging the battery.
What does this mean? In lithium phosphate batteries, while we charge our devices at the power outlet, the cathode, lithium iron phosphate, (shown in the picture) releases Li –ions and electrons that then find their way to the anode (Li –metal) through the electrolyte. While we use the device, Li-ions and electrons revert to LFP electrode – discharging. According to the mechanism, complete discharge of the battery should result in complete red hue and a fully charged battery should be all green. But this is not the case. We see some regions not releasing lithium and regions not receiving lithium back indicating inhomogeneous charging and discharging. Why is the charging/discharging not homogenous? The study hints at the importance of pore structure within the agglomerate. Mechanical cracking and inhomogeneous charging/discharging reduce the capacity as well as lifetime of a battery. This compels battery scientists to find sophisticated tools that can look at the electrode at work with nanoscale resolution. This will help them to understand what happens to the individual nanoparticles and identify suitable electrode pore structures that support uniform charging. Zooming into the region of interest to look at individual nanoparticles is not possible with TXM. This is because the size of the x-ray spot coming out of object is much too large to be focused by the objective lens; x-rays are diffracted around the objective lens aperture edges, making the image blurred. Extremely complicated lens designs are required to rectify the simple objective lens and it is a big challenge. If we reduce the lens aperture, the image will not receive much light and thus will not have enough contrast. The figure below provides a clear illustration of the diffraction limit that we are talking about. What we need is a nanoprobe with a likely spot size of 100 nm to look at individual nanoparticles (high spatial resolution) and that can reveal structural, morphological and chemical changes during battery charging/discharging. 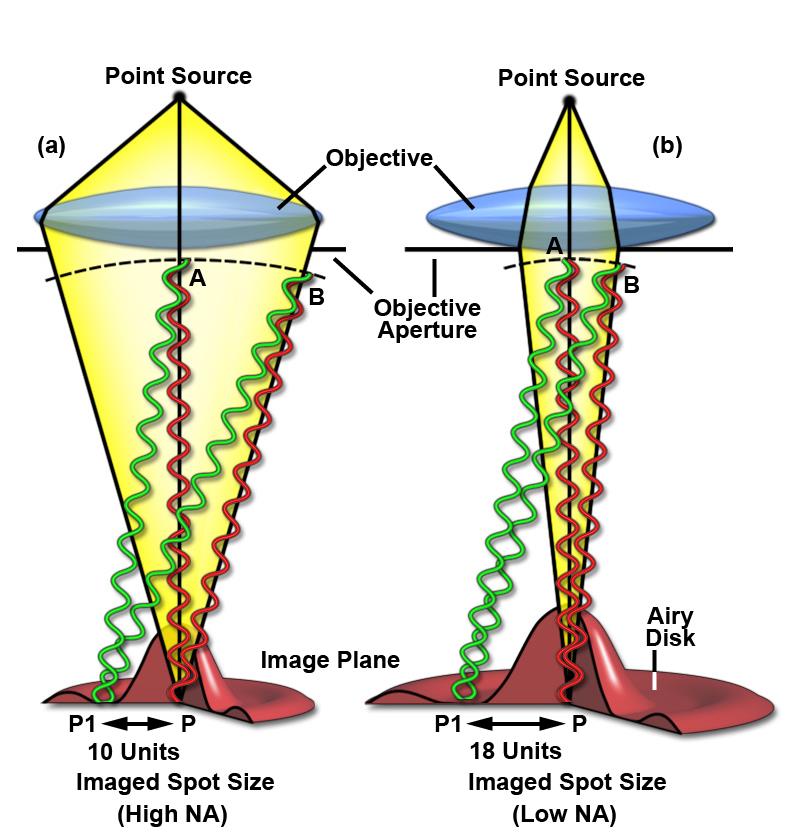
Figure 3 illustration of diffraction limit Source: http://www.microscopyu.com/techniques/super-resolution/the-diffraction-barrier-in-optical-microscopy
 Dr. Johanna Weker uses x-ray characterization techniques, especially x-ray microscopy, to study materials used in energy storage (batteries) and additive manufacturing (3D printing). Dr. Johanna Weker uses x-ray characterization techniques, especially x-ray microscopy, to study materials used in energy storage (batteries) and additive manufacturing (3D printing).
Spatial resolution depends on the wavelength of the light, angle and aperture.
D= λ/2n sinθ If we look at our currently available options, scanning electron microscopy provides smaller spot size, but is limited to the surface level; as electrons interact strongly with materials and lose their energy during interaction, they never penetrate more than a few nm below the material surface. Deeper probing of micrometer sized agglomerates requires strongly penetrating x-rays, especially at the higher energy end of the spectrum. The good news is that our modern synchrotrons are capable of producing intense tunable x-rays over a wide range of both soft (upto 10 KeV) and hard x-rays (10 KeV and above). X-ray diffraction (crystallography) could in principle provide the material structure at atomic precisions. But again we have a hurdle - related to our ability to extract the information on the precise position of atoms. This is a famous phase problem that has yet to be solved. In simple terms, when x-rays encounter an obstacle like an atom in a material, the photons get scattered. While the intensity of the scattering photons can be measured, the angle at which the x-ray photons are scattered is lost. Subsequently the information on the precise positions of atoms is lost. The structure of the object is only obtained by a trial and error method using approximations and refinement procedures. An emerging technique called x-ray ptychography is able to tackle the issue of optical elements and phase problem with a few tricks of the trade. Stanford Researcher Dr. Johanna Weker, at the SLAC National Accelerator Center, investigates degradation of battery materials using x-ray ptychography. The technique has proven its potential to reveal bulk material structure at nanoscale resolution. What is Ptychography anyway? Heard of photography, holography, tomography and a moment ago crystallography. How does ptychography work? In fact, ptychography is in a way related to all of them. “Ptycho” from Greek means, “fold”. Invented by Walter Hoppe, a German Physicist. The name derives from the optical configuration used n the experiment and in x-ray ptychogrphy, it means - interference between two Bragg reflections from coherently illuminated overlapping spots. Ptychography combines the strengths of two different techniques – coherent x-ray diffraction and scanning x-ray microscopy. What do we need to perform ptychography experiment? - Coherent x-rays and suitable algorithms for data refinement. 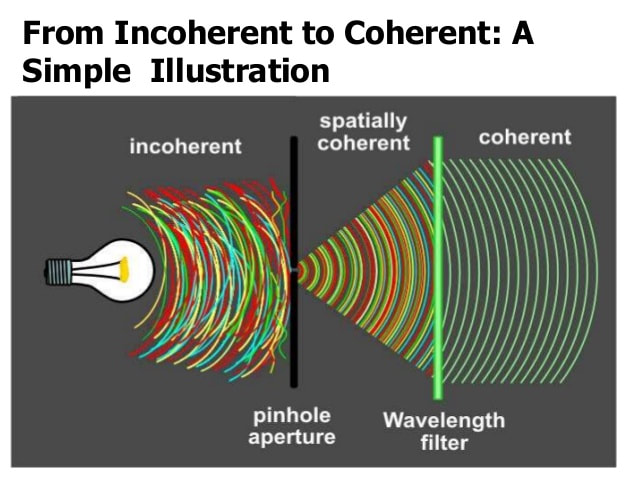
Figure 4 illustration of light coherency. Source: http://www.slideshare.net/DonRMuellerPhD/astonishing-astronomy-101-chapter-5
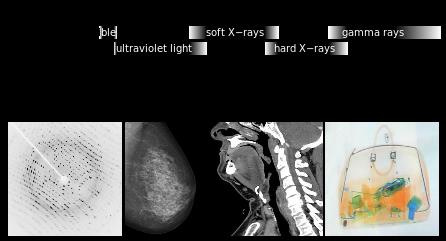
Figure 5 hard and soft x-rays energy range. Source: https://commons.wikimedia.org/wiki/File:X-ray_applications.svg
Ptychography addresses the two challenges – suitable objective lens and phase problem, in obtaining x-ray vision of materials in a very smart way. Solve challenge 1: Probe on nanoscale It is hard to manufacture complex objective lens for nanometer resolution. Okay, let’s eliminate the objective lens. The reward is almost 50% gain in the image brightness or contrast. Since no objective lens is used, the resolution is limited only by the wavelength of the x-ray. To compensate for the objective lens, the x-rays must be coherent – both temporally and spatially. We need monochromatic (temporally coherent) x-rays confined by pinholes or slits (spatially coherent). This is already achieved. X-rays produced at the synchrotron beam lines in bending magnet configuration are coherent (to certain extent). We can look into the material in detail to distinguish structures that are even 2nm (soft x-ray ptychography) and 10 nm (hard x-ray ptychography) apart. We have coherent x-rays and diffraction limit is not an issue anymore. Recently developed scanning transmission x-ray microscope operates also without objective lens (but the resolution is limited due to microscopy mode). Solve challenge 2: Detection Help from scanning x-ray microscopy solves the second challenge, the phase problem - indirectly. Obtaining absolute phases that is, the angle at which the x-rays are diffracted, is lost. There is no way to obtain the information that is lost. Then what is the Ptychographic trick? It is to measure diffraction patterns from two individual points (A and B for example) with the illumination overlapping (“fold”) by 50%. With the help of Iterative algorithms, absolute phase of the overlapping region, C can be guessed from diffraction pattern at A and diffraction pattern at B, individually. Here spot B serves as a feedback center while guessing the structure from diffraction pattern at A and vice versa. This way errors occurred while assuming the structure at the spot A can be eliminated. Of course, more spots will improve accuracy. We should note that the region C contains crucial information. Structure of the material at the spot A and B is thus imaged. By scanning the material spot by spot the entire material can be imaged with nm accuracy (theoretically 10 nm – 0.1nm, depending on the x-ray energy). 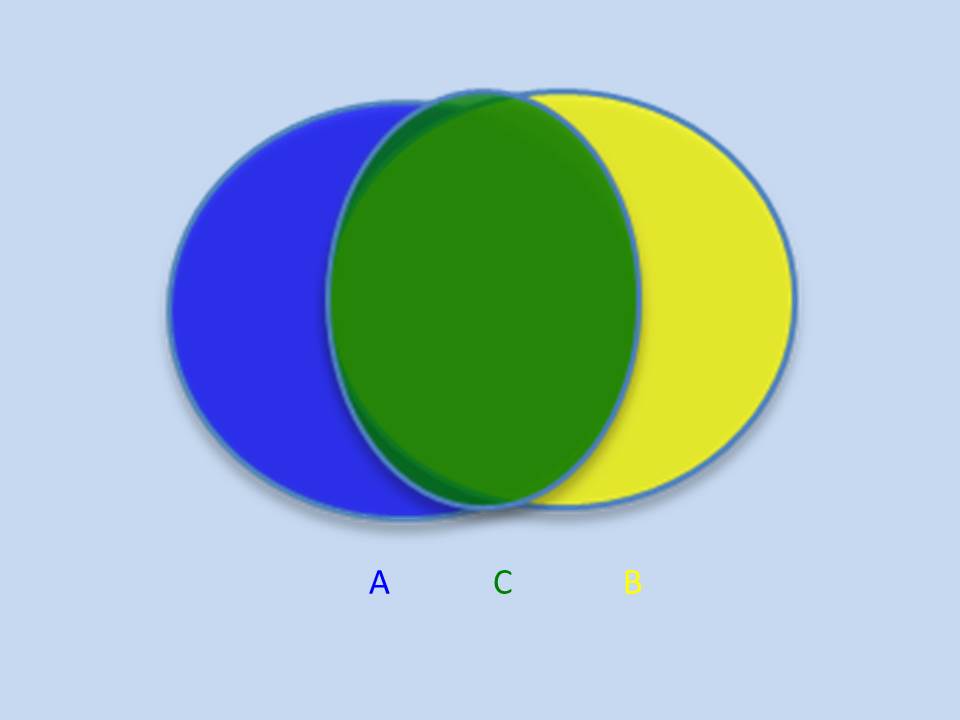
Figure 6 ptychographic scan
Essentially, x-ray ptychography is nothing but STXM operating in ptychography mode.
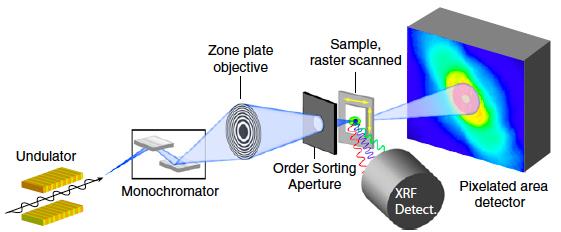
Figure 7 soft x-ray ptychography experimental set-up used to image algae, PNAS 2014, 112, 2314-2319
What are the demonstrated capabilities of x-ray ptychography? What does an x-ray ptychography image look like? With x-ray ptychography, chemical and structural information can be extracted even for thick samples (micrometer) with unprecedented spatial resolution. X-ray ptychography is most desirable in detecting elements with lower atomic mass such as carbon, nitrogen and oxygen where conventional fluorescence techniques fail due to low fluorescence yields. In ptychography, one can obtain something called optical density image that reveal morphology of the nanoparticle such as cracks. Look at the power of ptychography (a) in revealing cracks in a sample of lithium iron phosphate sample compared to STXM (b), around 700 eV x-ray energy. 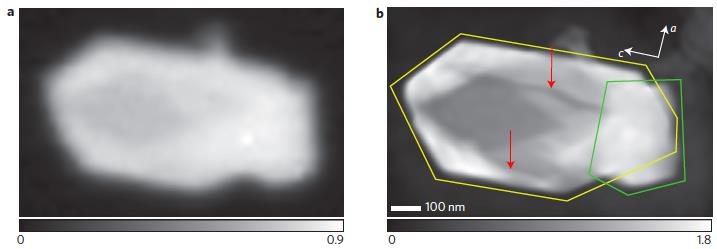
Figure 8 optical density images by (a) STXM and (b) x-ray ptychography, Nature Photonics 2014, 8, 765
Here are optical density images of lithium iron phosphate nanoparticles obtained from STXM (a) and ptychography (b). Clearly ptychography image indicates multiple particles (outlines) and cracks (red arrows) while STXM could show only a blurred image. Combining chemical imaging with optical density map is extremely revealing. Color-coded optical density map below distinguishes regions containing LiFePO4 (red) and FePO4 (blue) in lithium iron phosphate battery.
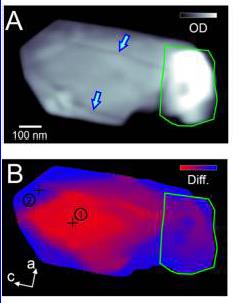
Figure 9 Optical density map from x-ray ptychography (a) morphology (b) chemical imaging, Nano Lett. 2015, 15, 4282-4288
Since ptychography set-up is very similar to that of STXM, modifying already existing STXM layout at the beam lines with new hardware is sufficient. Effort is required to create suitable software to collect diffraction data and reconstruct the diffraction patterns so the material structure can be evaluated, but can be achieved. Hard x-ray ptychography is now well established while soft x-ray ptychography is still under development. An interesting application of x-ray ptychography is in biological sciences. Recently, (low atomic mass) elemental distribution in frozen algae was obtained using x-ray ptychography. 3D structure determination is another attractive feature of x-ray ptychography that is emerging. Apart from biologists, additive manufacturing research can greatly benefit from this method. X-ray ptychography is a boon to nanoscience. 
About the Author
Dr. Vijayalakshmi (Viji) Kalyanaraman is a part-time chemistry instructor and a freelance editor. She received her PhD from the University of Hamburg, Germany for investigating interfacial electron dynamics using synchrotron x-rays. She also enjoys communicating scientific research to the general audience through blogs. Comments? Leave them below! |
Archives
February 2023
DiscovHER BlogScientista DiscovHER is a blog dedicated to discovHERies made by women in science. Follow us for links to the latest resHERch! Categories
All Alexandra Brumberg Amy Chan Avneet Soin Chemistry Diana Crow Engineering Health/medicine Indulekha Karunakaran Iqra Naveed Johanna Weker Lidiya Angelova Michael Clausen Mind Brain And Behavior Muhammad Hamza Waseem Nikarika Vattikonda Opinion Prishita Maheshwari-Aplin Technology Uma Chandrasekaran |
Search by typing & pressing enter
 RSS Feed