|
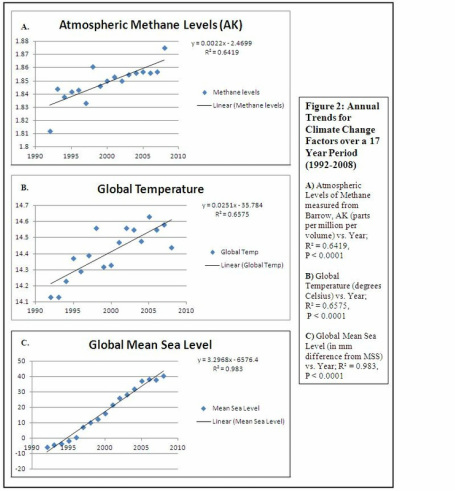
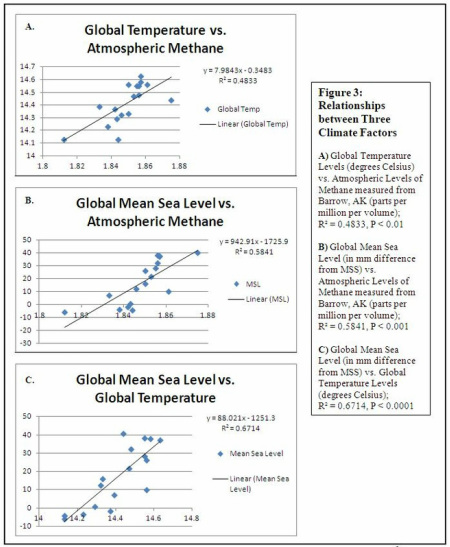
12/29/2011 0 Comments Global Warming, Too Real(Columnist's Note: Part 4 of the Having a Successful Relationship with Research is still in the works. It will be up shortly!) This past semester, I decided to take a class called Statistics for Biology, taught by Professor John Wakeley. As part of the final project, I had the opportunity to analyze any set of data I wanted. Not having enough of my own data yet from working in the Wagers Lab, the new lab that I joined this semester, I decided to download data sets online. I chose to look at the relationships between three climate change factors: atmospheric methane levels, global temperature, and global mean sea level. Doing the statistical analyses using Excel and by hand, it was empowering to see for myself that indeed, climate change is no joke. I looked at data from 1992 to 2008, a seventeen-year period. If you're interested in hearing more, feel free to read the abstract to my paper, located below the images and to comment!  Over the seventeen-year period that I examined (1992-2008), all three climate change factors have increased (and significantly so, as shown through t-tests that I perform in my paper).  These linear regressions show that there are positive correlations (which I later prove are significant) between a response variable (on the X-axis) and an explanatory variable (on the Y-axis). A. As atmospheric methane levels increase, so does global temperature. B. As atmospheric methane levels increase, so does global mean sea level. C. As global temperature increases, so does global mean sea level. Presumably, the mechanism of action should be something along the lines of: Greater Atmospheric Methane Levels cause Higher Temperatures (due to the greenhouse effect) which cause Increases in Global Mean Sea Level by melting polar ice caps Abstract In a three-part statistical analysis, I first followed three separate data sets that contained measurements of global sea level, global surface temperature, and atmospheric methane (measured from the Barrow Weather Station in Alaska) between the years 1992 to 2008. Despite the acknowledged increase in these three particular causes and effects of global warming by national agencies, the statistical analyses associated with these claims are not made readily available to the general public. Thus, by performing linear regressions and calculating correlation coefficients, I was able to reinforce the claims that there has been a significant increase in global sea level, global surface temperature, and atmosphere methane levels over time. Additionally, I compared the three climate change factors to each other and found that all were significantly correlated between the recent years of 1992 to 2008. In the last part, I tested my hypothesis that Barrow, AK temperatures correlate with atmospheric methane levels (measured in Barrow, AK) differently than New York statewide temperatures (an arbitrary location). By performing this comparison, I provided evidence that location subsets of the global temperature data set correlate differently with atmospheric methane levels from Barrow, AK.
0 Comments
Leave a Reply. |
What's HotGet the DigestAbout the Blogger
Stephanie M. Wang is a Chemical and Physical Biology major at Harvard College, Class of 2013. She is a pre-med who just can't get enough of the hard sciences. She loves learning new things, frisbee, poetry, every kind of apple, people. Stephanie blogs regularly for the Scientista Foundation: Find her blog here!
More From Stephanie |
The Scientista Foundation, Inc. All Rights Reserved © 2011-2021 | Based in NY | [email protected]
The Network for Pre-Professional Women in Science and Engineering
The Scientista Foundation is a registered 501(c)(3) -- Donate!
The Network for Pre-Professional Women in Science and Engineering
The Scientista Foundation is a registered 501(c)(3) -- Donate!


 RSS Feed